Immersive Analytics

Immersive Analytics - Handheld, Open-Standards and Web-based

Visualization researchers need to develop and adapt to today’s new devices and tomorrow’s interface technology. Today, people interact with visual depictions mainly through a mouse and, gradually, by touch. Tomorrow, they will be touching, grasping, feeling, hearing, smelling, and even tasting data.

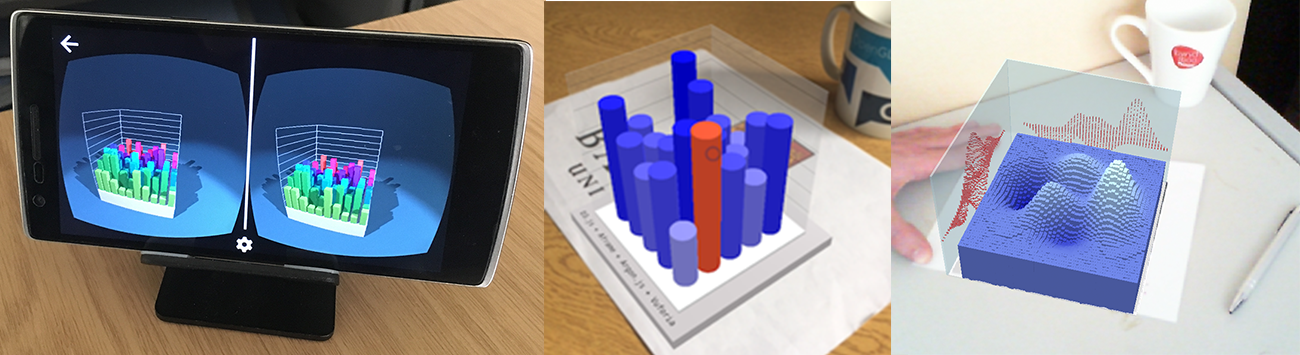
This theme explores the concept of immersive, multisensory, post-WIMP visualization and investigates how information visualization can employ different display and presentation technologies, such as head-mounted displays, projection systems, wearables, tabletop displays and haptic interfaces. We are currently exploring different technologies that could enable IA in different scenarios.

The <VRIA> Web-based framework for Immersive Analytics

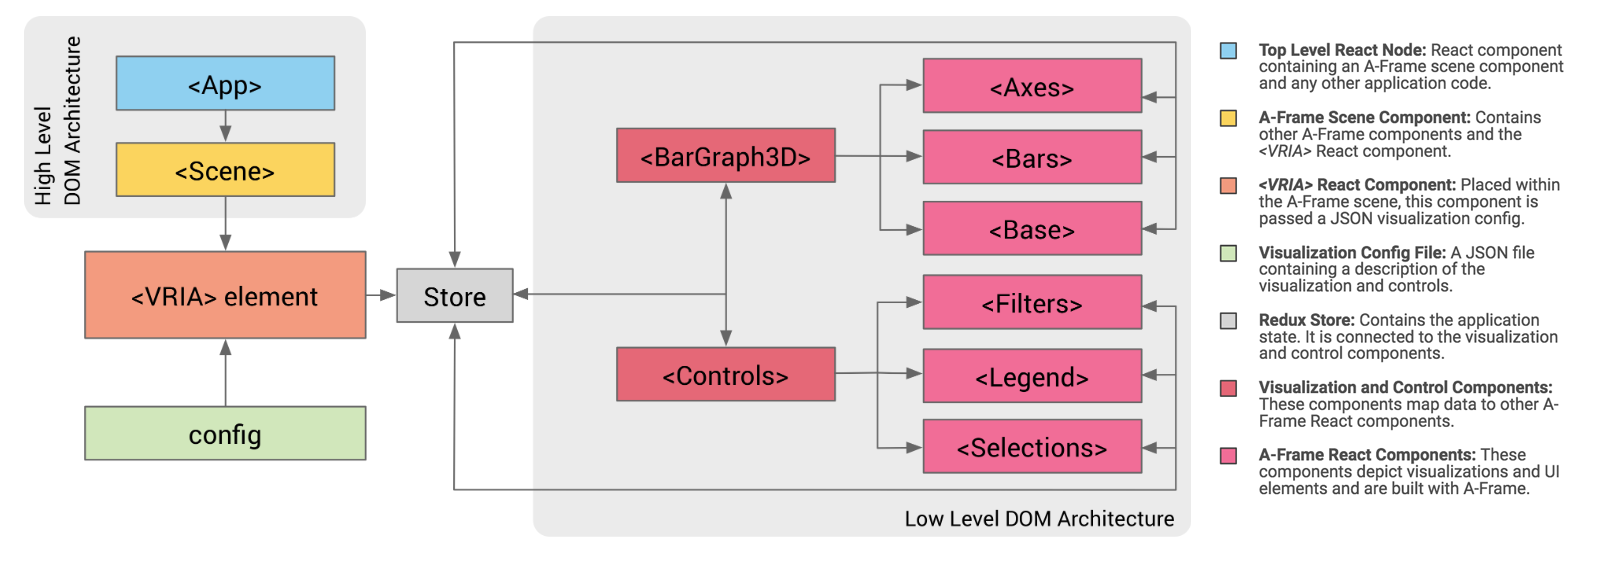
We are especially interested in using web technologies, such as WebVR/XR, for prototyping. We (with our colaborator Peter Butcher from the University of Chester) have been been working towards the development of an open-standards web-based framework, called <VRIA>, that facilitates the creation of virtual spaces suited for immersive analytics.

Overview of the <VRIA> framework and functionality. Extract from our poster presented in IEEE VIS 2018 (see below for links).
Figure 1: Overview of the <VRIA> framework and functionality. Extract from our poster presented in IEEE VIS 2018 (see below for links). [PNG]

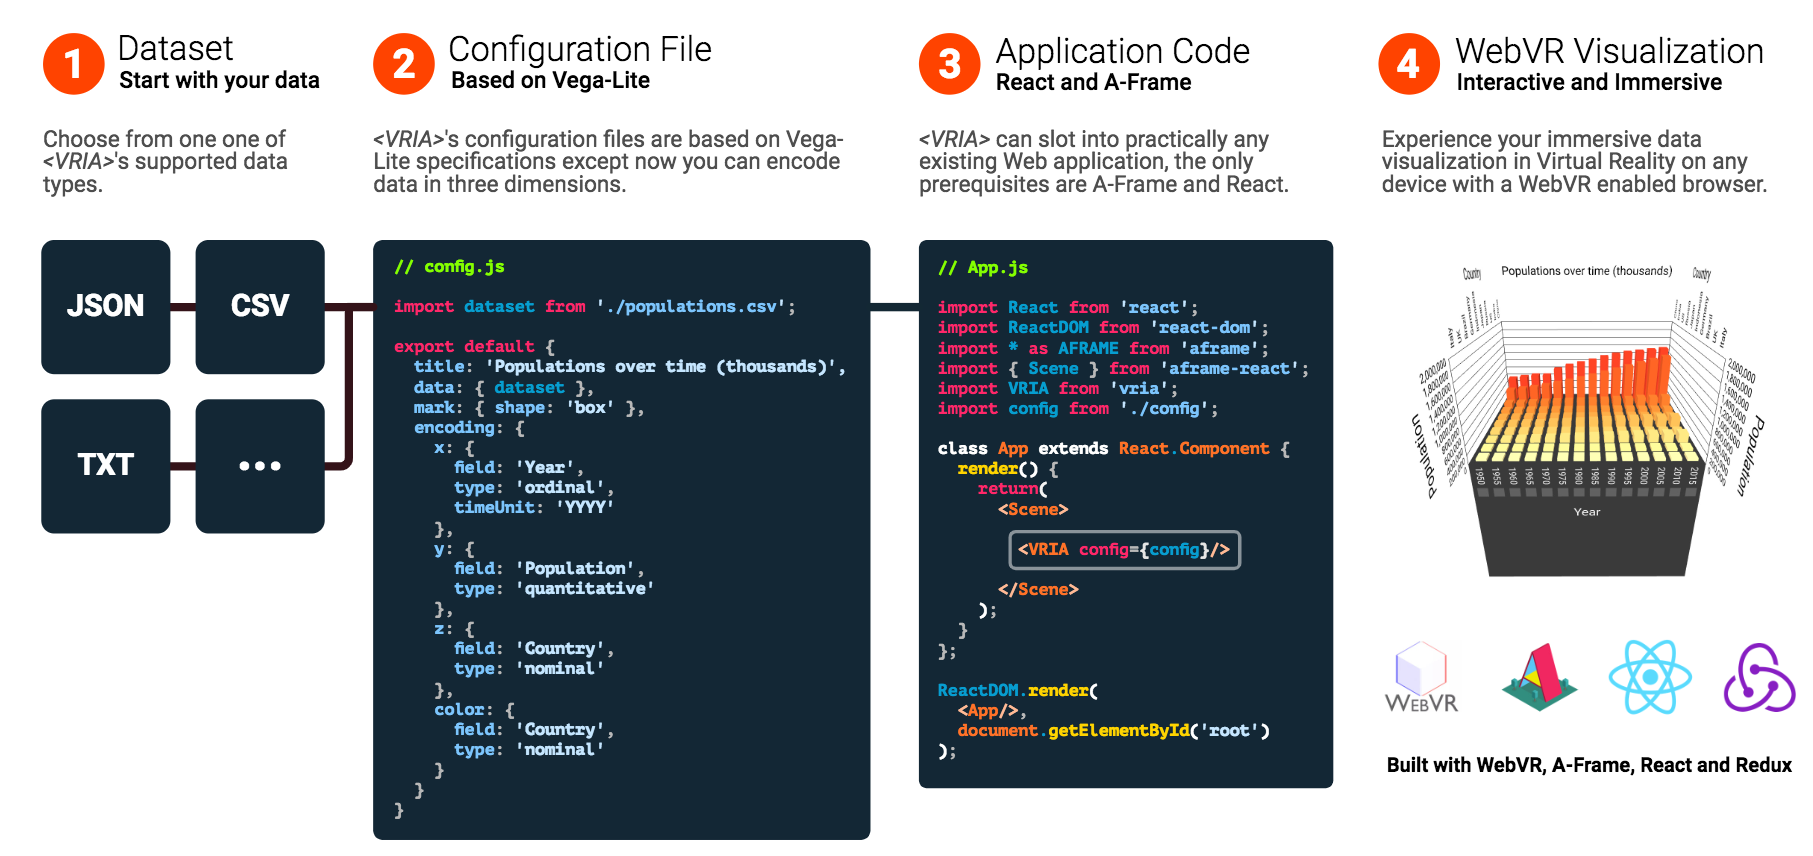
Currently <VRIA> supports 3D bar charts and multivariate scatter plots with more visualization types planned. Every visualization component has a corresponding set of interaction components which can be configured in the visualization configuration file. New interactions can be written with A-Frame and React and added to your application with <VRIA>'s API.

Overview of the <VRIA> architecture. Extract from our poster presented in IEEE VIS 2018 (see below for links).
Figure 2: Overview of the <VRIA> architecture. Extract from our poster presented in IEEE VIS 2018 (see below for links). [PNG]

With a number of enhancements planned, in the next phase we are looking to build more 3D visualization components, along with corresponding interaction mechanisms. We also plan to integrate features that allow collaborative tasks in VR space. More information on the <VRIA> framework can be found here, as we complete the work.

Stand-alone Web-based MR Prototypes

We have also been using emerging JavaScript frameworks and tools, such as AWE.js, AR.js and Argon.js for recent work on IA in MR/AR. These have been presented in various instances as posters and workshop papers (see below). In all case, we explore the synergy of different tools over the HTML DOM. We essentially use the data maniputlation mechanisms offered by libraries like D3.js and match it to depictions built with A-Frame, along with different registration mechanisms. We have also explored the concept of Synthetic Visualizations, which are a synthesis of physical, tangible objects and computer-generated information registered on said objects.

We have created a series of ptototypes, exploring Immersive Analytics with Web-technologies. One of our first prototypes used WebVR polyfill to display on Google Cardboard a 3D barchart, built using <a href="https://d3js.org/" target="_blank">D3.js</a> and <a href="https://aframe.io/" target="_blank">A-Frame</a> (left). We have also used <a href="https://www.argonjs.io/" target="_blank">Argon.js</a> and <a href="https://aframe.io/" target="_blank">A-Frame</a> for doing a similar depiction in handheld MR (middle). Finally, we explored the synergy beteen QR codes and AR targets to control both the data and the registration of MR-based data visualizations. See below for links to publiched and under-progress work (right).
Figure 3: We have created a series of ptototypes, exploring Immersive Analytics with Web-technologies. One of our first prototypes used WebVR polyfill to display on Google Cardboard a 3D barchart, built using D3.js and A-Frame (left). We have also used Argon.js and A-Frame for doing a similar depiction in handheld MR (middle). Finally, we explored the synergy beteen QR codes and AR targets to control both the data and the registration of MR-based data visualizations. See below for links to publiched and under-progress work (right). [PNG]

For more info about our IA projects contact Dr Panagiotis Ritsos, here.

Collaborators (in various publications)

Bangor University, University of Maryland - College Park, Edinburgh Napier University, University of Applied Sciences and Arts Northwestern Switzerland College Park, University of Chester

  1. P. W. S. Putcher, N. W. John, and P. D. Ritsos, “Towards a Framework for Immersive Analytics on the Web,” in Posters presented at the IEEE Conference on Visualization (IEEE VIS 2018), Berlin, Germany, 2018.   [bib]  
  1. P. D. Ritsos, J. Mearman, J. R. Jackson, and J. C. Roberts, “Synthetic Visualizations in Web-based Mixed Reality,” in Immersive Analytics: Exploring Future Visualization and Interaction Technologies for Data Analytics Workshop, IEEE Conference on Visualization (VIS), October 1-6, Phoenix, Arizona, USA, 2017, 2017.   [bib]  
  1. P. D. Ritsos, J. Mearman, J. Jackson, and J. C. Roberts, “Web-based Immersive Analytics in Handheld Augmented Reality,” in Posters presented at the IEEE Conference on Visualization (VIS), October 1-6, Phoenix, Arizona, USA, 2017.   [bib]  
  1. P. W. Butcher and P. D. Ritsos, “Building Immersive Data Visualizations for the Web,” in Proceedings of International Conference on Cyberworlds (CW’17), Chester, UK, 2017.   [bib]  
  1. P. W. S. Butcher, J. C. Roberts, and P. D. Ritsos, “Immersive Analytics with WebVR and Google Cardboard,” in Posters presented at the IEEE Conference on Visualization (IEEE VIS 2016), Baltimore, MD, USA, 2016.   [bib]  
  1. J. C. Roberts, P. D. Ritsos, S. K. Badam, D. Brodbeck, J. Kennedy, and N. Elmqvist, “Visualization beyond the Desktop–the Next Big Thing,” IEEE Computer Graphics and Applications, vol. 34, no. 6, pp. 26–34, Nov. 2014.   [bib]  
  1. J. C. Roberts, J. W. Mearman, and P. D. Ritsos, “The desktop is dead, long live the desktop! – Towards a multisensory desktop for visualization,” in Death of the Desktop Workshop, IEEE Conference on Visualization, Paris, France, 2014.   [bib]  
  1. P. D. Ritsos, J. W. Mearman, A. Vande Moere, and J. C. Roberts, “Sewn with Ariadne’s Thread - Visualizations for Wearable & Ubiquitous Computing,” in Death of the Desktop Workshop, IEEE Conference on Visualization, Paris, France, 2014.   [bib]  

Videos