VMG News
IEEE CG&A journal paper invited in IEEE VIS2015
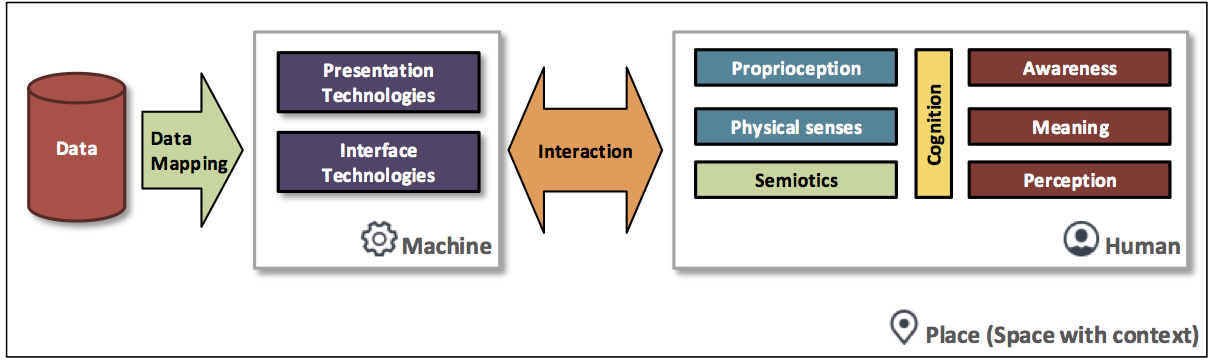
Our publication Visualization Beyond the Desktop - the next big thing has been accepted in IEEE Computer, Graphics and Applications, and invited for presentation in IEEE VIS 2015. Ever since the dawn of the personal computer, researchers have been developing new and novel ways for humans to interact with them. Especially over the past 10 years these “novel interaction devices” have become cheaper and more available, aided certainly by crowdsourced initiatives (such as Kickstarter). These new interaction devices enable us to interact with data in new ways, and utilise more senses in this ‘human-computer interaction’. Devices such as LeapMotion enable remote 3D positions to be gathered; haptic devices such as Geomagic Touch (formerly Phantom Omni) provide 3D forces; Scentee adds smell to a smartphone. Not only can we now see and manipulate our data through a mouse, but we can start to touch, hear, taste and even smell it. Dr Roberts says: “We need to think differently: we can do more than merely ‘seeing data’ in a visual form”, “There is a huge potential for multi-sensory manipulation, and visualization is only one possible application avenue”.
Abstract
Visualization is coming of age. With visual depictions being seamlessly integrated into documents, and data visualization techniques being used to understand increasingly large and complex datasets, the term “visualization”’ is becoming used in everyday conversations. But we are on a cusp; visualization researchers need to develop and adapt to today’s new devices and tomorrow’s technology. Today, people interact with visual depictions through a mouse. Tomorrow, they’ll be touching, swiping, grasping, feeling, hearing, smelling, and even tasting data. The next big thing is multisensory visualization that goes beyond the desktop.
Reference
- J. C. Roberts, P. D. Ritsos, S. K. Badam, D. Brodbeck, J. Kennedy, and N. Elmqvist, “Visualization beyond the Desktop–the Next Big Thing,” IEEE Computer Graphics and Applications, vol. 34, no. 6, pp. 26–34, Nov. 2014. [bib]